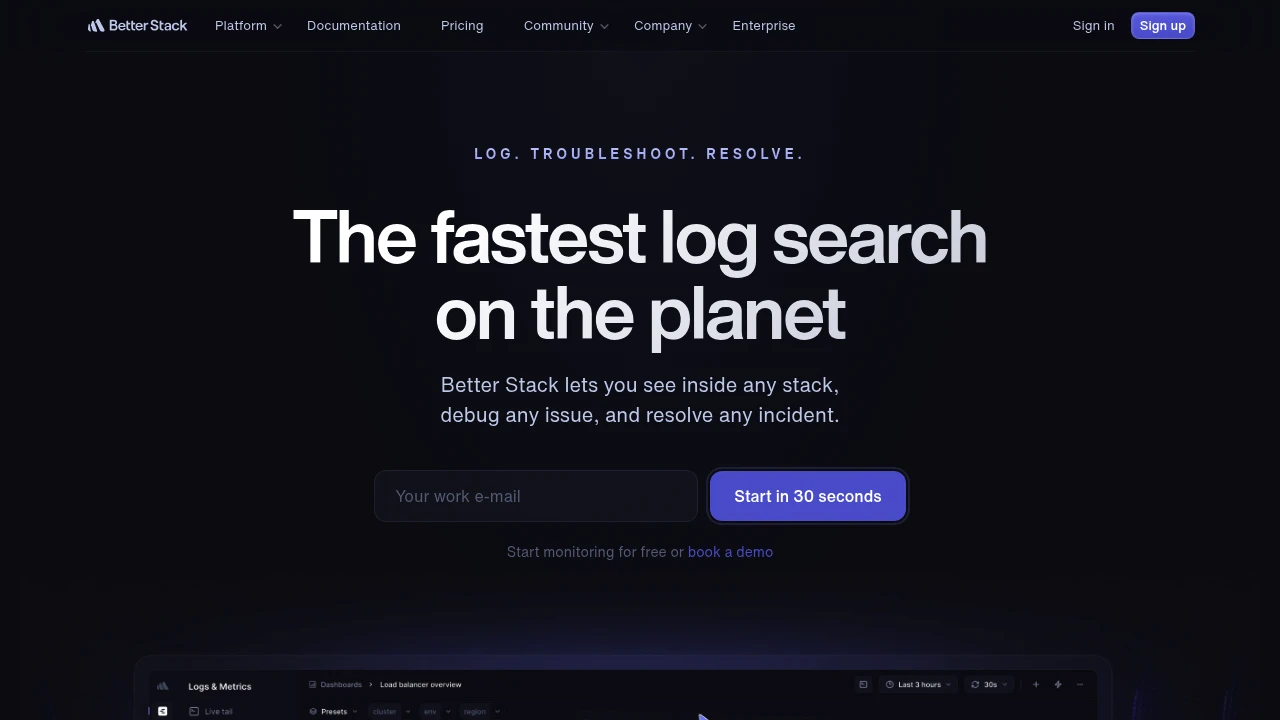
Visualize your entire stack, aggregate all your logs into structured data, and query everything like a single database with SQL.

Gain comprehensive visibility into your entire technology stack with this powerful observability platform. It aggregates all your logs from servers, applications, containers, and cloud providers into structured, queryable data. Search billions of log lines per second using familiar SQL syntax, eliminating the need for rehydration or cold storage. Customize data retention per source and query everything you need, anytime. Plaintext logs are automatically transformed into structured JSON, simplifying context filtering with single-click actions.
Key features include:
- Ultra-fast log search: Query up to 1 billion log lines per second.
- Collaborative dashboards: Work together with teammates in real-time to investigate issues.
- SQL-based querying: No need to learn proprietary query languages.
- Anomaly detection & alerting: Get notified of irregularities before they become incidents.
- Integrated incident management: Includes on-call scheduling, escalation policies, and status pages.
- Scalability and compliance: Reliably handles terabytes of data and meets SOC 2 and GDPR standards.
This solution offers significant cost savings by leveraging efficient data processing and storage.
Categories:
Tags:
European alternatives similar to BetterStack Telemetry:
Gain deep insights into your Ruby, Elixir, Node.js & Python apps with error tracking, performance monitoring, host metrics, and custom dashboards. Fix issues fast.
European Alternative to:
Access full application logs, not just crashes, to resolve bugs effectively and enhance customer support. Get real-time error alerts and user feedback.
European Alternative to:


